Cap Rate Calculation for Vacation Rental Properties

The formula is simple: Average Daily Rate multiplied by Occupancy Rate multiplied by 365. Neither of those first two inputs is fixed, which is where the real work begins.
ADR moves constantly — think of it as a tide that rises and falls with season, day of week, local events, and competitive supply in the immediate submarket. For a property you haven't bought yet, use tools that pull actual listing data from comparable properties nearby, not the seller's marketing materials. For an existing STR, pull twelve months of platform payouts and read what they say. According to AirDNA's 2026 State of Short-Term Rentals report, average daily rate growth across U.S. short-term rentals was roughly 1.5% in 2025. Any projection assuming aggressive ADR appreciation should be scrutinized carefully given that trend.
Occupancy is the variable that sinks the most underwriting. Long-term rental models budget around five percent vacancy. Vacation rentals can realistically run thirty to forty percent vacancy, or worse, depending on location and how saturated the market is. The beach house that runs ninety percent full in July might sit at thirty percent in January — a feast-and-famine rhythm that monthly figures will never honestly capture. Always use annualized occupancy. Always. Monthly figures flatter the math in ways that will eventually embarrass you.
The range across markets is genuinely wide. Some achieve occupancy in the low eighties; many coastal and mountain markets with premium pricing run substantially lower. Neither extreme is inherently good or bad. But you need to know which regime your target property actually sits in before you build any other number.
From annual gross revenue, subtract vacancy losses to get Gross Operating Income. Ancillary income — pet fees, parking, early check-in charges — can be added if it's recurring and documented in the property's actual history. If it isn't already happening at this property, leave it out of your projection.
Building the operating expense stack for a short-term rental
NOI equals Gross Operating Income minus Total Operating Expenses. On a short-term rental, those expenses run materially higher than most investors expect the first time they see a real pro forma. The range spans roughly thirty to seventy percent of gross revenue, depending on management model, market, and property type.
Platform fees come off the top. Airbnb, VRBO, and direct-booking channels each carry their own cost structures; none of them are rounding errors.
Cleaning and turnover typically runs ten to fifteen percent of gross revenue. Professional cleaning after every guest, linens laundered or replaced, toiletries restocked. These costs scale with occupancy, which makes them behave differently from fixed expenses, and which is why high-occupancy properties don't always deliver proportionally higher margins.
Property management is one of the biggest swing items in the whole stack. Professional STR management typically runs twenty to thirty percent of gross income. Investors who plan to self-manage at acquisition and outsource later routinely undercount this in their initial projections, which produces a cap rate the property will never actually deliver. Model it as if you're going to outsource, even if you aren't. If it still works, you have room to maneuver.
Property taxes are market-specific and increasingly complicated. Several jurisdictions have created STR-specific tax classifications that diverge from standard residential rates. Insurance requires a specialized policy; a standard homeowner's policy carries a different risk profile and fails to cover what needs covering.
Maintenance and repairs should be budgeted at five to ten percent of net rental income. This covers routine upkeep and minor repairs, not major capital replacements, which belong in a separate CapEx reserve rather than in operating costs. Supplies and restocking are individually small and collectively material over a full year. Utilities are typically owner-paid in short-term rentals, unlike most long-term leases. Licensing, permits, HOA fees, and local compliance costs close out the stack.
What doesn't belong in operating expenses matters just as much. Mortgage principal and interest reflect financing, not operations. Capital expenditures belong in a CapEx reserve. Mixing any of this into operating costs distorts NOI and produces a cap rate that misrepresents what the property actually does.
A reasonable working range for a well-run STR is total operating costs of forty to fifty-five percent of gross revenue. Any projection below thirty-five percent needs to be interrogated line by line. The expenses first-time investors most consistently miss: platform fees, linen replacement cycles, guest supply restocking, and maintenance reserves. Those four categories alone account for the gap between a model that looks good on paper and a property that underperforms for years.
A worked example from gross revenue to cap rate
Real numbers, one property.
A three-bedroom home in a popular tourist market, purchased for $425,000. Annual gross revenue — bookings plus cleaning fees collected from guests plus ancillary income — totals $57,500. Annual operating expenses total $29,950. NOI is $27,550. Cap rate: $27,550 divided by $425,000, equals 6.5%.
That $29,950 includes platform fees, cleaning and turnover scaled to actual occupancy, property taxes, STR insurance, maintenance reserves, utilities, guest supplies, and licensing. No mortgage payment. No CapEx reserves. No income taxes. Fold any of those in and the NOI figure is wrong, and the cap rate becomes meaningless as a performance metric.
A note on the denominator. For a new acquisition, use purchase price plus closing costs plus any renovation required to make the property rent-ready. For a property you've held several years and whose market value has drifted well above original purchase price, current market value is the more accurate denominator. The cap rate will shift in year two once one-time closing costs are no longer embedded in the cost basis. That's expected. It doesn't mean anything changed operationally.
At 6.5%, this property sits in the middle of the range that characterizes most established vacation rental markets today. Whether it's a good investment depends entirely on the context around it.
What counts as a good cap rate in 2026, and how market type shapes the answer
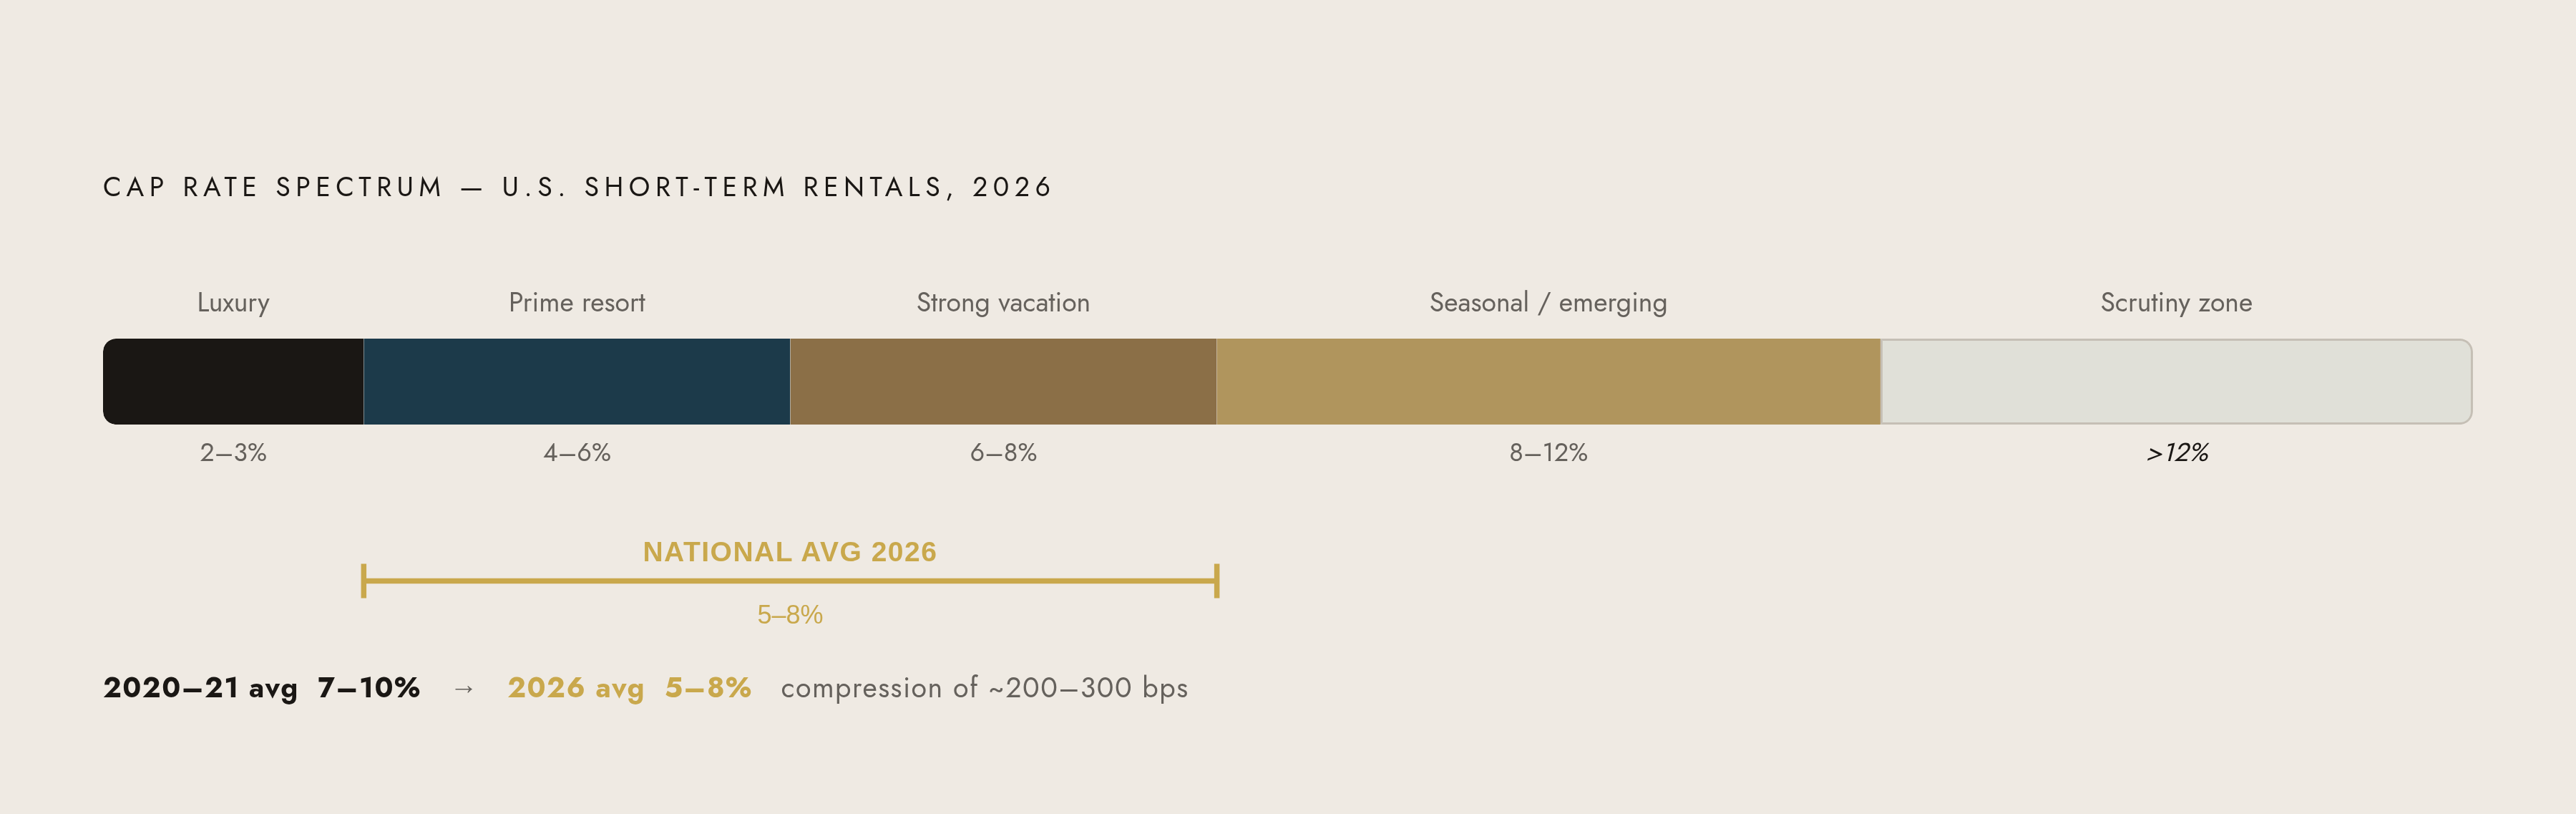
According to AirDNA's 2026 State of Short-Term Rentals report, the national average cap rate for short-term rentals in 2026 sits in the five to eight percent range, down from the seven to ten percent that was common in 2020 and 2021. That compression is almost entirely a function of property values rising faster than rental income. Increased STR supply in popular markets has also pressured both nightly rates and occupancy, eroding NOI even in markets where gross revenue looks healthy on the surface.
The tiers work like this. Prime resort markets trade in the four to six percent range; investors there are pricing in asset quality and equity appreciation, not yield. Six to eight percent characterizes strong vacation rental markets where income and asset value are reasonably balanced. Eight to twelve percent signals higher potential returns, often in seasonal or emerging markets where the demand base is less established. Above twelve percent warrants real scrutiny. That number often reflects inflated revenue assumptions, weak demand fundamentals, or capital investment that isn't showing up in the expense stack.
Luxury markets at the high end of the price spectrum often trade in the two to three percent range. The values are simply high relative to achievable NOI. The return proposition is appreciation and asset quality; anyone underwriting these deals for cash yield is doing it wrong.
At the other end, some of the highest cap rates in 2026 appear in markets where median home prices are low, not where revenue is exceptional. A market with a median home price under $90,000 and mid-range occupancy can produce cap rates approaching sixteen percent, driven almost entirely by the denominator. A market with median prices around $200,000 and occupancy in the low eighties produces cap rates near fourteen percent. These are fundamentally different investment propositions than a premium coastal market at five percent, and they carry different risk profiles: demand volatility, thinner liquidity, and regulatory uncertainty that premium markets have largely already absorbed.
Within-city variation can be just as dramatic as cross-market differences. A property near a major tourist attraction can outperform a property a few miles away in a residential neighborhood by a wide margin. Market averages mislead at the granular level. Neighborhood-level analysis is optional only for investors comfortable with blind spots.
Variables that will change your cap rate after you buy
The cap rate you underwrite at acquisition is not the cap rate you'll run in year three. Some of what moves it is in your control. A lot of it isn't.
Management model changes are immediate and direct. Moving from self-management to professional management adds twenty to thirty percent of gross revenue in costs, dropping NOI materially. Professional management can improve occupancy and optimize pricing, but the net effect on cap rate must be modeled before you acquire, not after you've already closed.
Seasonality will distort any metric calculated over a partial year. Monthly cap rate can diverge sharply from the annual figure. Owners who calculate only summer performance will significantly overestimate annual NOI — and they will find out why in February.
Regulatory change is the most consequential external variable, and it is accelerating. In Illinois, STR properties became subject to the state hotel occupancy tax effective July 1, 2025 (Illinois Department of Revenue, Hotel Operators' Occupation Tax guidelines). Rhode Island raised its statewide local hotel tax and created a new tax specifically on whole-home STRs (Rhode Island Division of Taxation, 2025). Hawaii increased its Transient Accommodations Tax starting January 1, 2026, and added a new surcharge on STRs (Hawaii Department of Taxation, Act 204, 2024). New York City's enforcement of Local Law 18 reduced legal STR listings from roughly 22,000 to approximately 3,000 since September 2023, according to data from Inside Airbnb, restructuring supply in a way that helped remaining legal operators while eliminating the investment thesis for everyone else. San Diego implemented a tiered permit system that caps whole-home STR licenses at one percent of total housing stock (San Diego Municipal Code, Chapter 5, Article 8, Division 1). Every one of these changes flows directly into operating expenses and compresses NOI. The regulatory direction of travel in 2025 and 2026 has broadly trended toward increased taxation and tighter permitting, though local outcomes vary.
One counterweight on the tax side: the One Big Beautiful Bill Act, signed July 4, 2025, permanently restored one hundred percent bonus depreciation for qualifying property placed in service after January 19, 2025. Furniture, appliances, and certain improvements can be fully deducted in year one. That meaningfully improves after-tax cash flow for STR investors, though it doesn't change cap rate itself, which excludes income taxes by design.
On supply: according to AirDNA's 2026 State of Short-Term Rentals report, available STR listings across the U.S. are projected to reach 1.77 million in 2026, up from 1.69 million in 2025, while demand growth is projected at roughly 4.1% year over year. In markets where supply is growing faster than demand, downward pressure on both nightly rates and occupancy follows directly.
Why cap rate alone isn't enough when you're using a mortgage
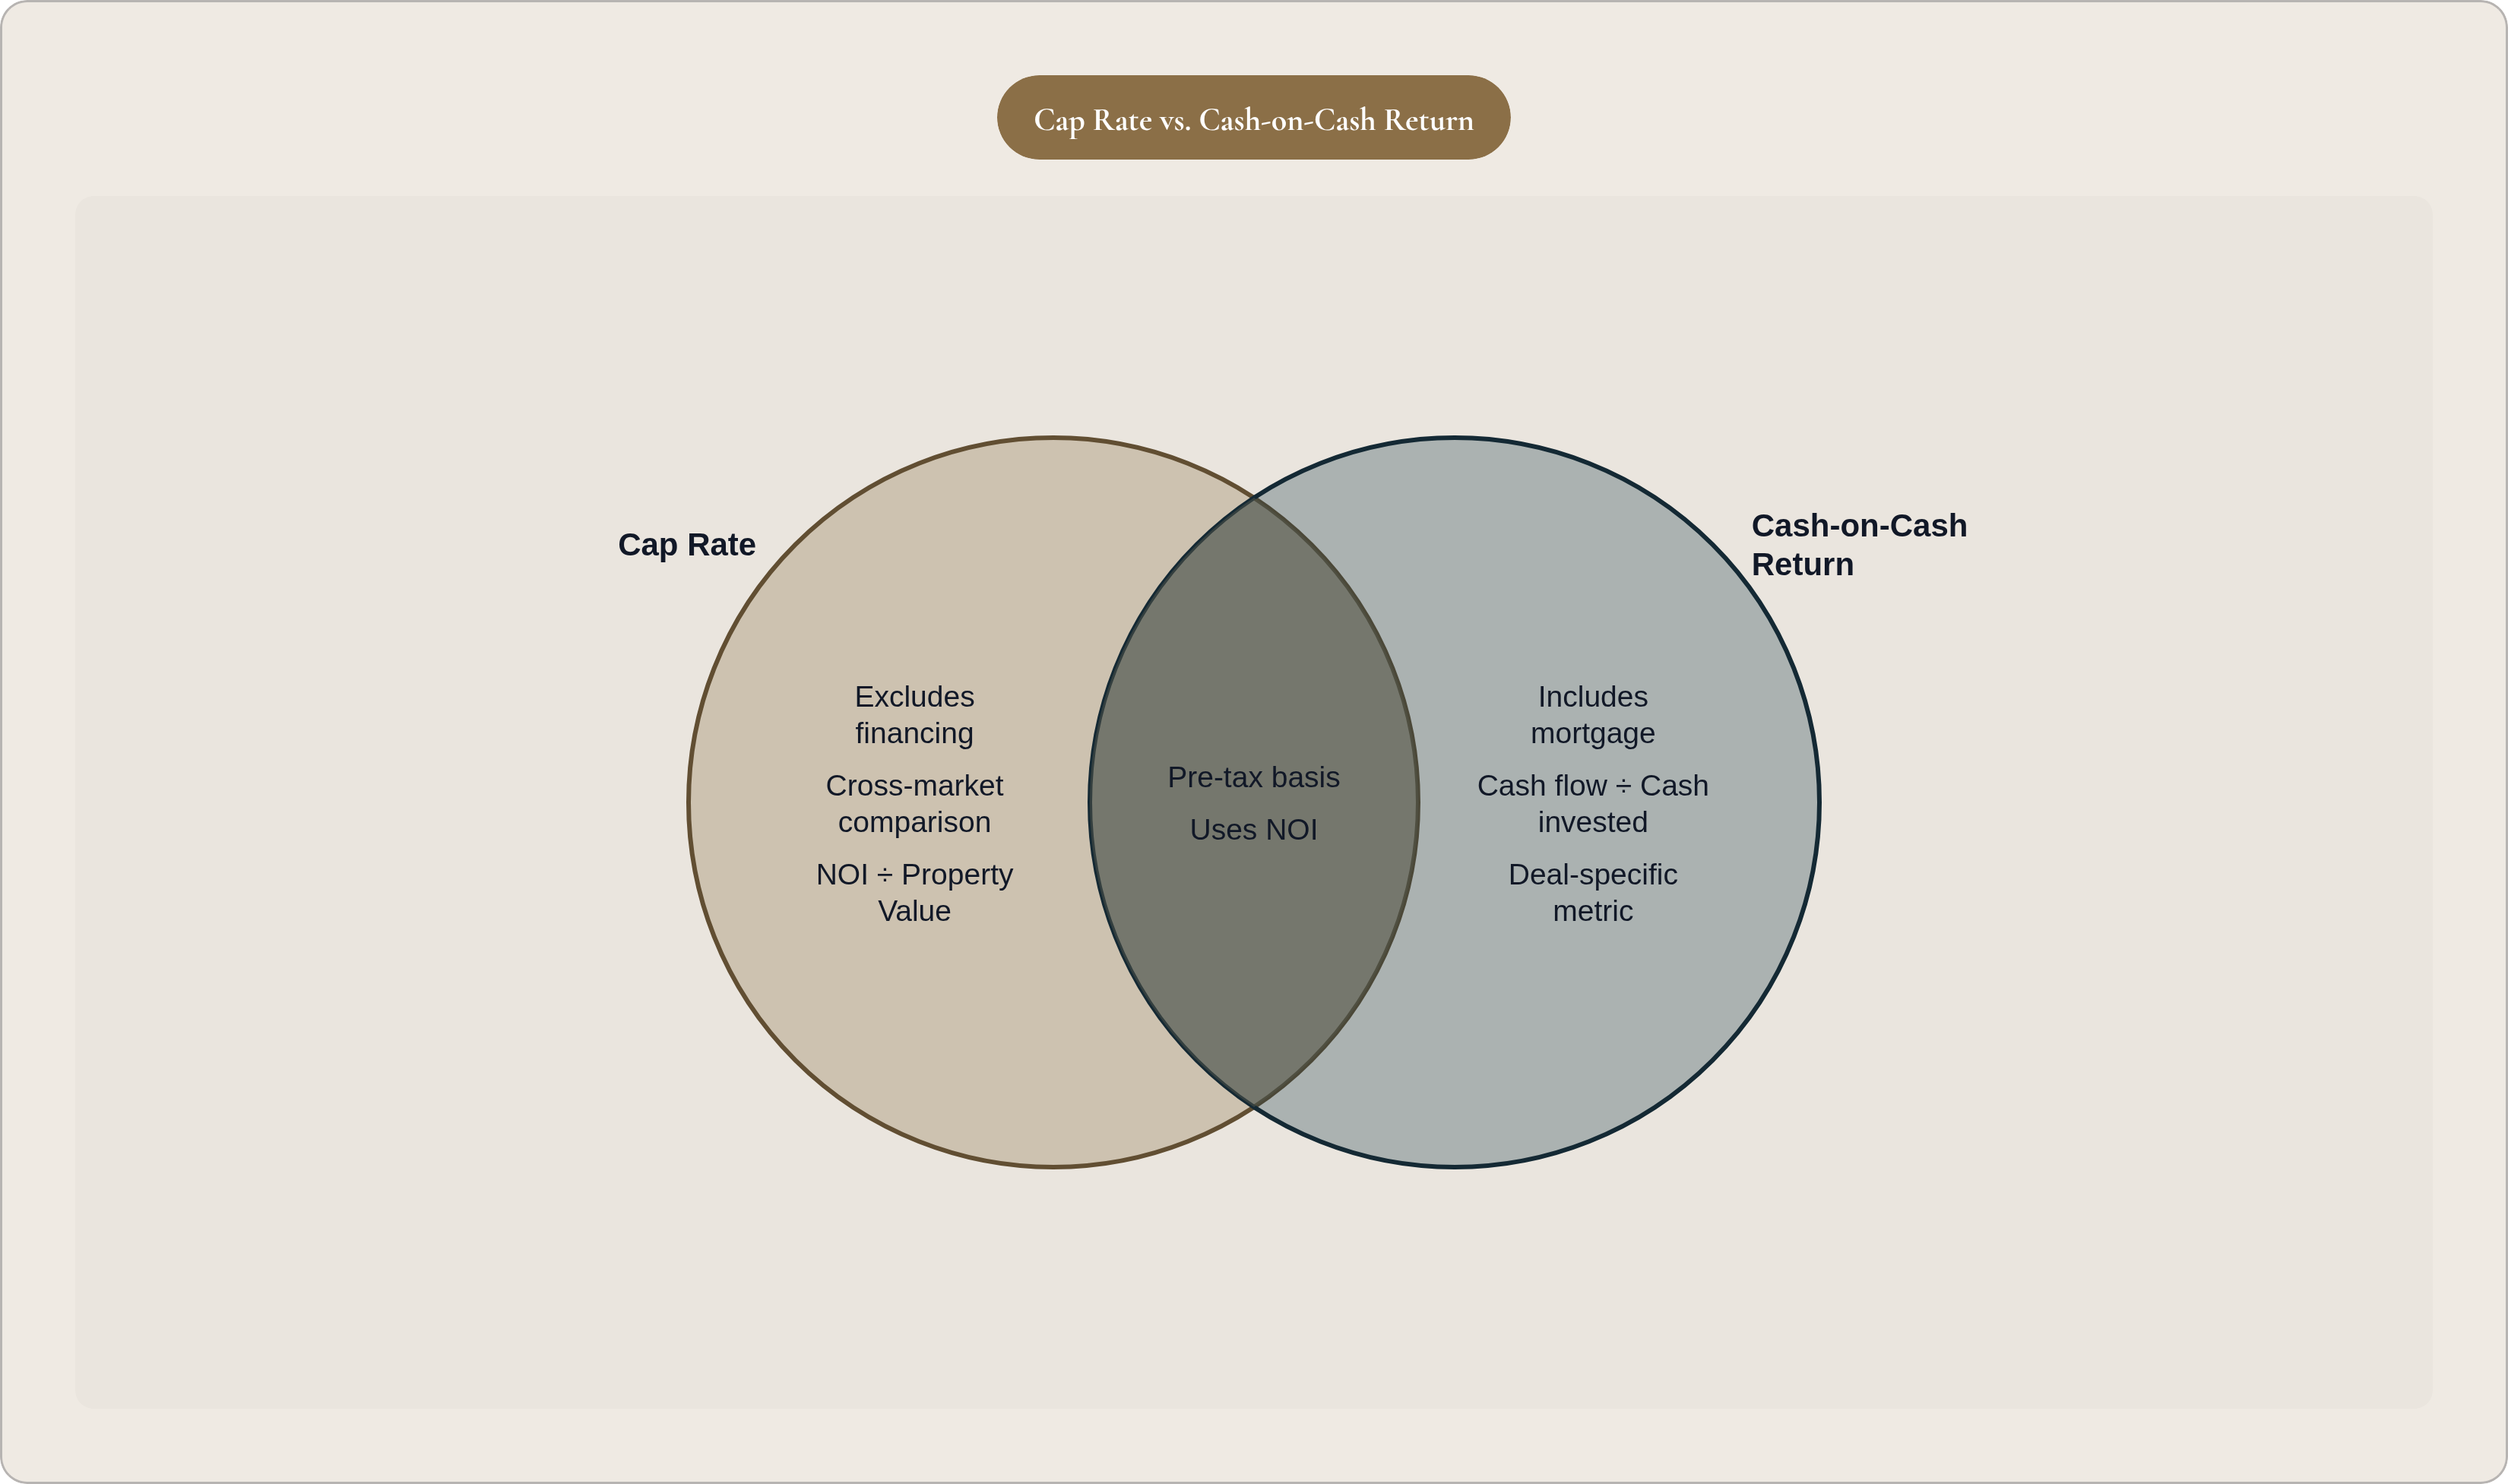
Cap rate measures property performance as if the asset were purchased entirely with cash. The moment a mortgage enters the picture, you need a second metric.
That metric is cash-on-cash return: annual pre-tax cash flow divided by total cash invested, expressed as a percentage. Annual pre-tax cash flow is NOI minus debt service, principal and interest combined. Total cash invested is your down payment plus closing costs plus any upfront renovation. Put $100,000 into a deal, receive $10,000 back after all expenses and loan payments, and your cash-on-cash return is ten percent.
The two metrics answer different questions. Cap rate tells you how the property performs operationally, independent of financing, which makes it useful for comparing properties across markets on equal footing. Cash-on-cash return tells you how the investment performs given how you're actually paying for it, which makes it useful for evaluating a specific deal as structured. You need both. They are sequential, not redundant.
Neither metric captures appreciation, and for luxury markets where equity growth drives most of the total return, that omission matters. Cap rate also assumes a reasonably stable income stream, which makes it least reliable for properties with highly seasonal use patterns, short intended holding periods, or deferred maintenance sitting outside the operating expense calculation. A low cap rate property with a near-term roof replacement will underperform what the cap rate suggests, because that CapEx event will arrive whether or not it appears in NOI.
The practical sequence: build the cap rate first to evaluate the property on its own operational merits, independent of financing. Layer in cash-on-cash return to evaluate the investment as you're actually going to structure it. Hold both numbers alongside a direct read of the regulatory environment and where the market sits in its supply cycle. None of these metrics works in isolation, and none of them substitutes for understanding the specific market you're buying into.