Rental Returns on Luxury Short-Term Properties

AirDNA pegged the broad US vacation rental market at an average ADR of $338.83 in June 2025. Luxury markets live in a different universe entirely. Miami, Aspen, Malibu: nightly rates in those markets commonly run $450 to $700. Nantucket and Aspen at the very top routinely clear $1,000 per night.
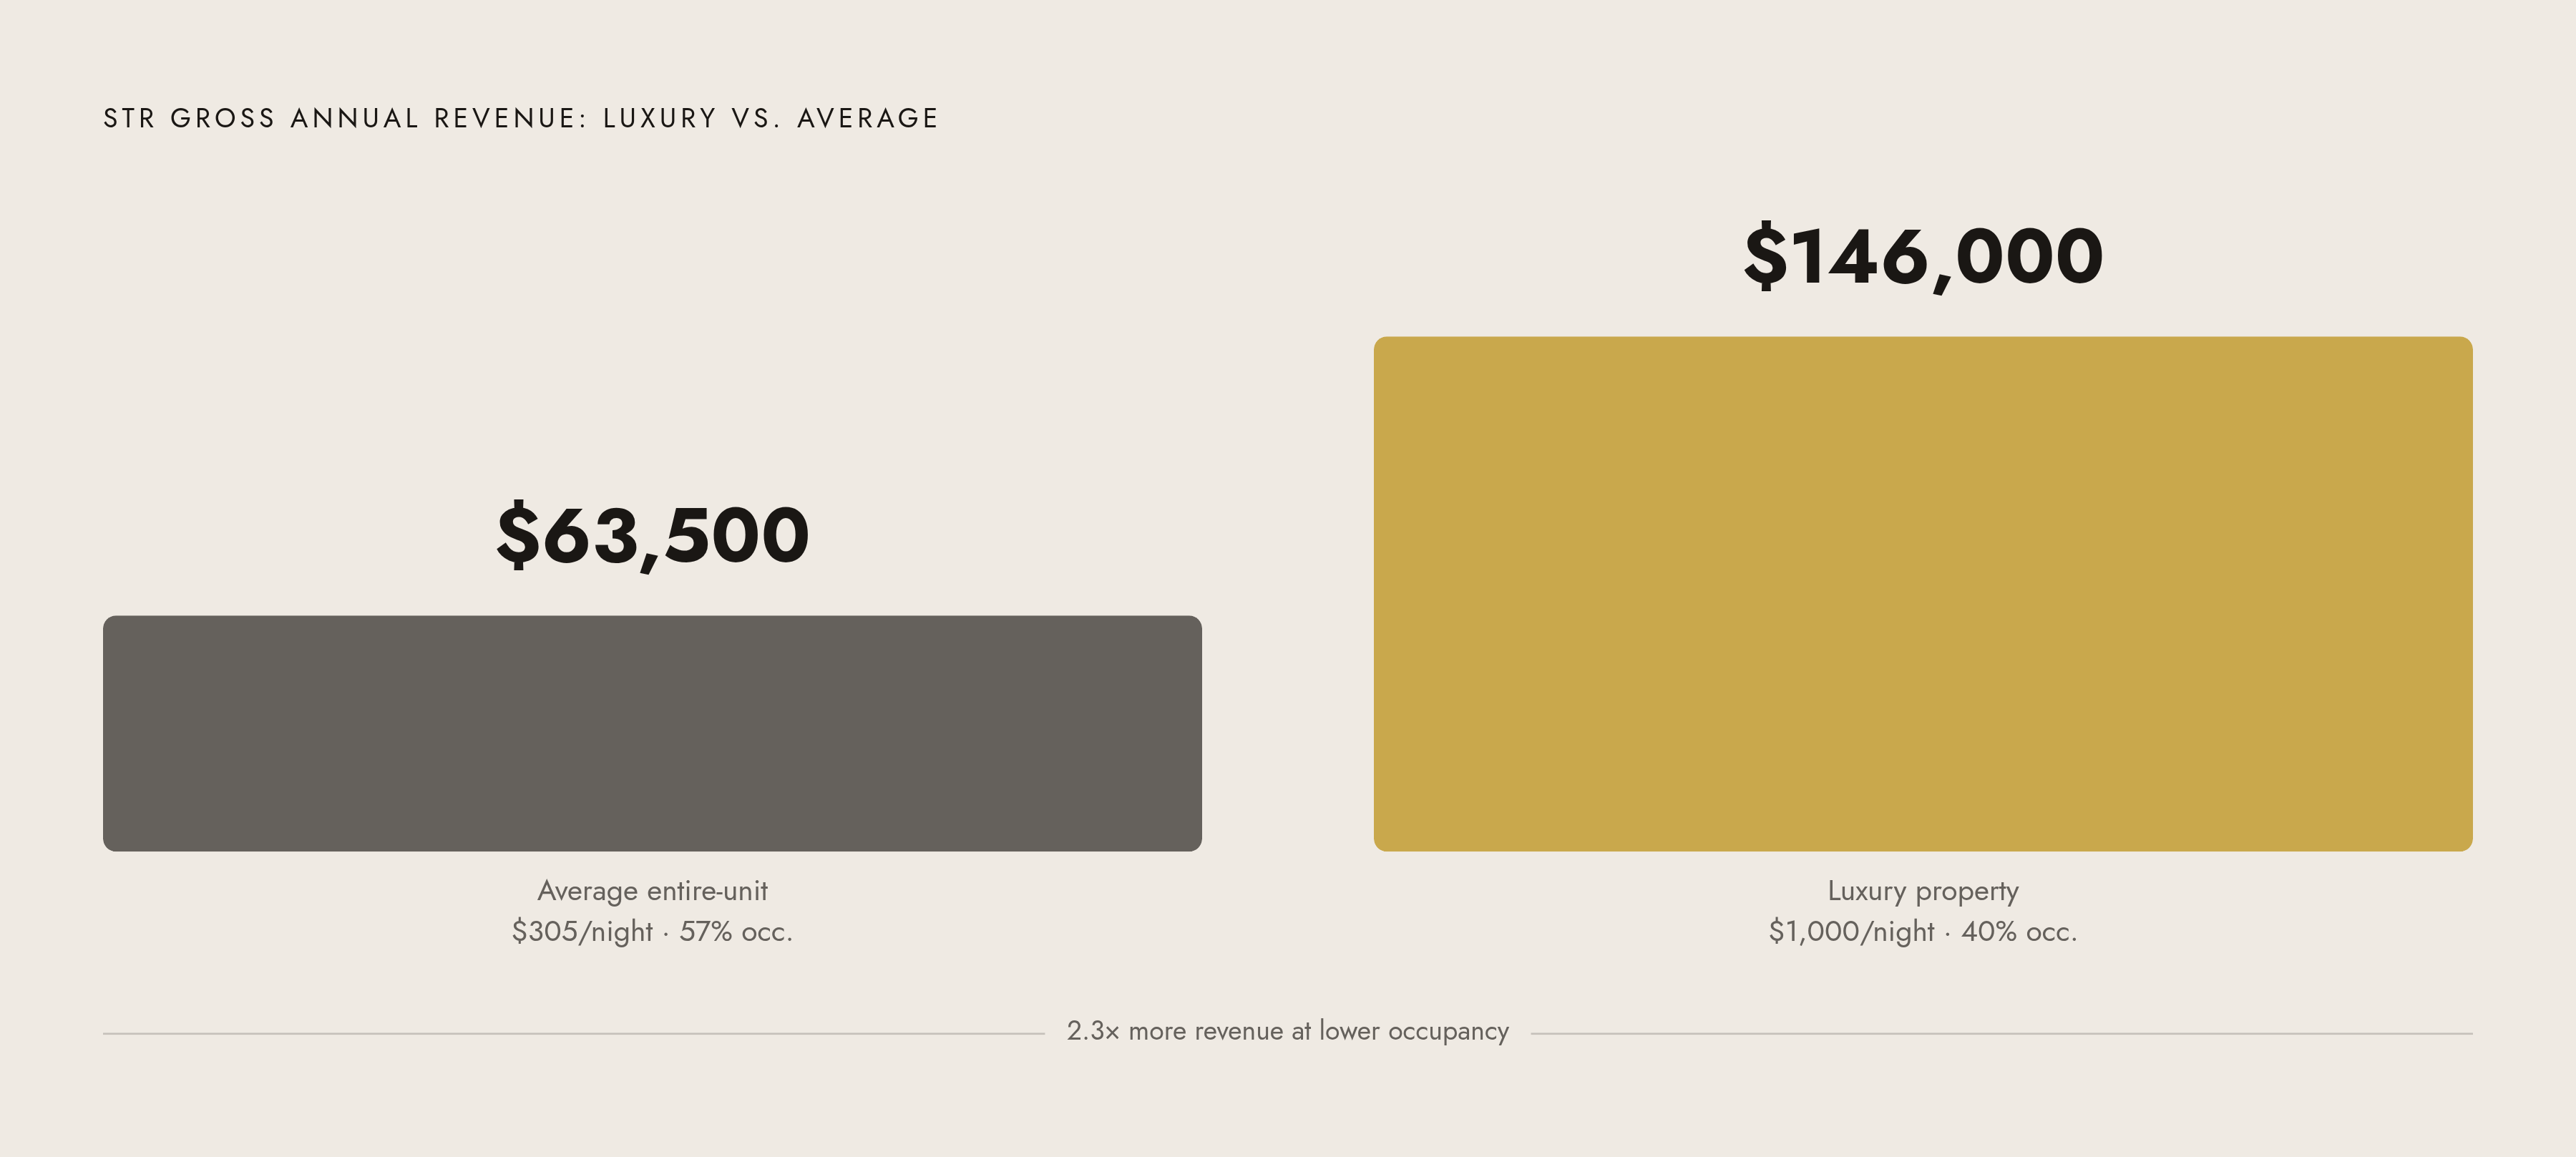
The revenue math at that level becomes almost uncomfortable to look at side by side. A property clearing $1,000 a night at 40% occupancy, just 146 nights a year, generates $146,000 in gross revenue. A property running the average entire-unit Airbnb rate of around $305 per night at 57% occupancy generates roughly $63,500. Less than half, for a property that often carries comparable acquisition costs, insurance, taxes, and maintenance overhead.
Seasonality compounds this. In vacation markets, rates commonly swing 40 to 80% between peak and off-season. Christmas, New Year's, Spring Break: demand in some markets surges 200 to 250% above average nightly rates during those windows, per AirDNA seasonal data. In luxury markets, those peaks are steeper, and the guest cohort is measurably less price-sensitive. There is simply no equivalent ceiling available to budget or mid-tier properties, no matter how well they're managed.
What makes the ADR story durable rather than a COVID-era artifact: STR Global reported revenue per available room growing 8.1% year-over-year in January 2025, driven by ADR growth outpacing modest occupancy softness. The market is pricing upward even as occupancy normalizes. That's not the profile of demand that has already exhausted itself.
A high nightly rate produces nothing when the calendar is empty, though. That's where occupancy enters the picture.
What Occupancy Looks Like in the Luxury Segment and Why It Differs from the Broad Market
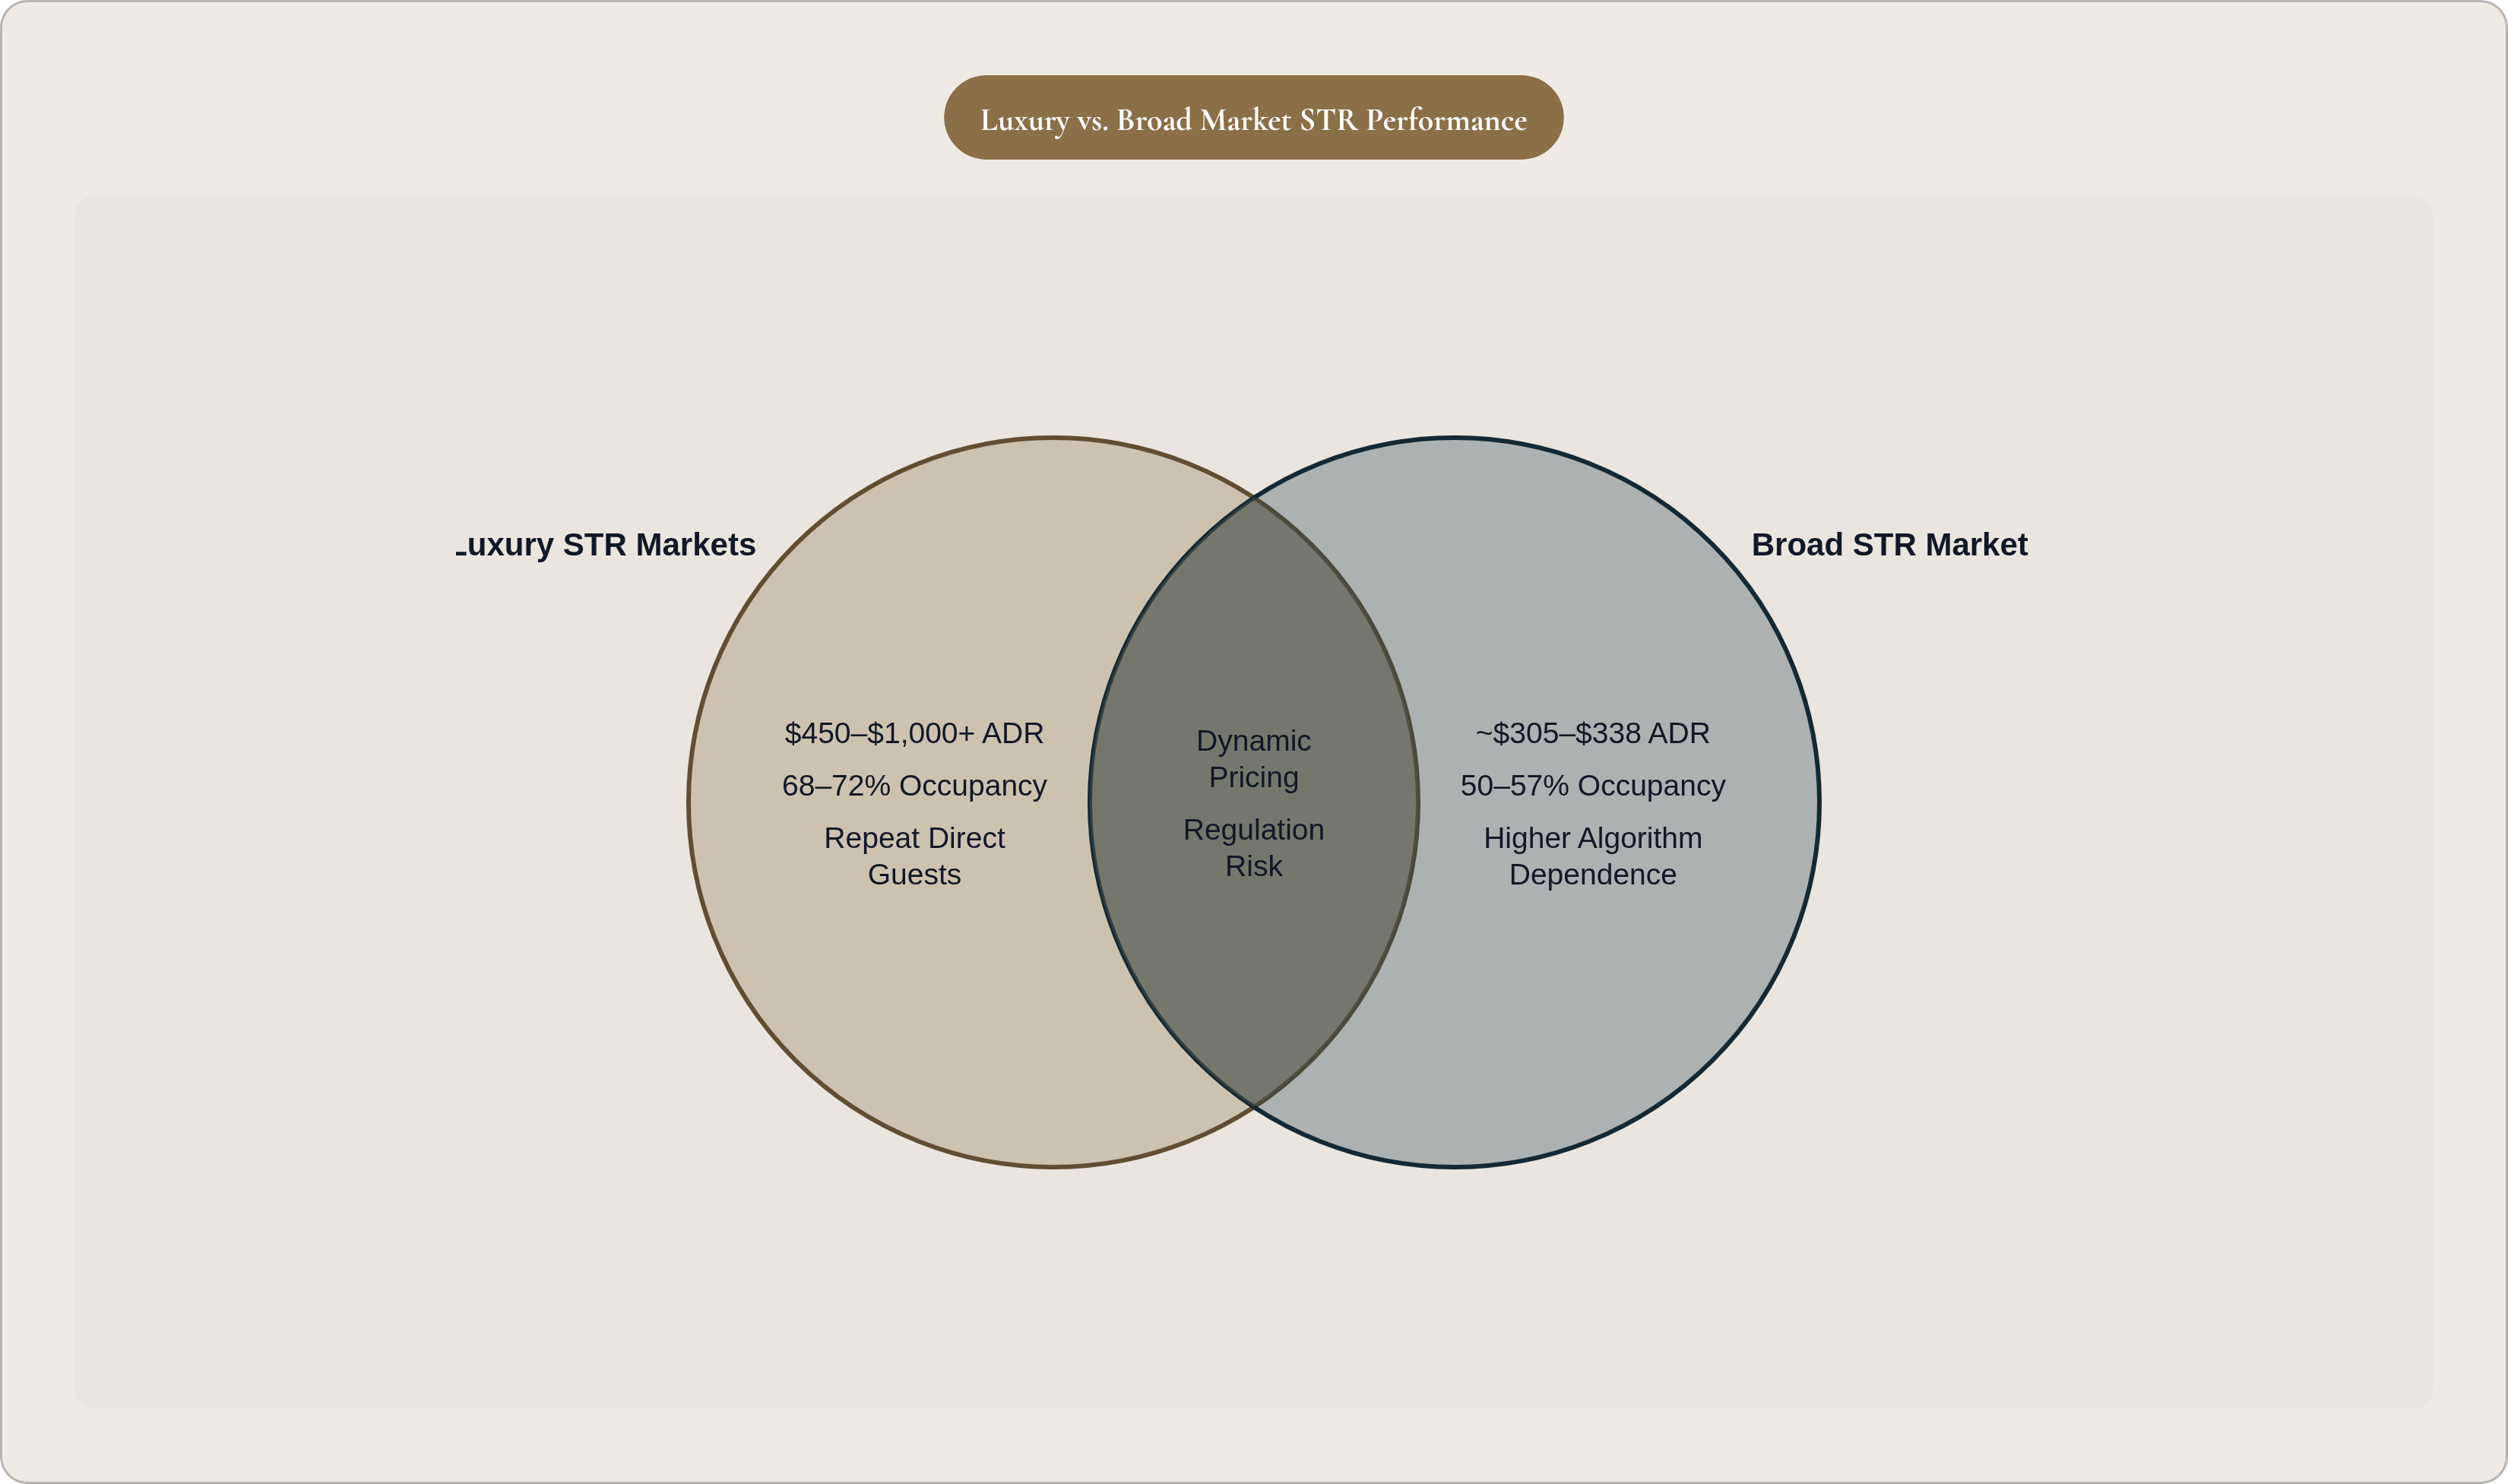
Broad market STR occupancy averaged approximately 57% in 2024 and drifted to around 50% by April 2025, per AirDNA. The luxury segment runs above that range consistently. High-demand luxury vacation destinations have been averaging 68 to 72% occupancy, up from around 65% in 2023. That gap isn't an accident.
Luxury travelers book longer stays. A family securing a two-week summer rental at a lakehouse fills the calendar in a single transaction, which is materially more efficient than stringing together seven back-to-back two-night bookings from seven different strangers. Group travel amplifies this further. Family reunions, corporate retreats, wedding parties: they concentrate demand into larger homes and generate extended, high-value stays that a two-bedroom condo in a suburban market cannot attract.
Premium properties also generate repeat guests at a meaningfully higher rate. A guest who pays $4,000 for a four-night stay and leaves having experienced something genuinely exceptional will book directly the following year. That direct relationship reduces vacancy between stays and softens the owner's dependence on platform algorithms. Most operators underestimate how much that's worth until they've spent a few years paying Airbnb's cut on guests who would happily have come back anyway.
One wrinkle worth understanding: AirDNA booking-window data shows that in January 2025, 31% of bookings were made within five days of check-in, nearly double the 16% seen in August 2023. By May 2025, that figure still sat at 24%. For luxury properties, this creates a specific strategic question. Do you hold inventory for last-minute premium buyers, or discount early to guarantee a fill? The answer isn't obvious, and it matters more than most owners initially think.
ADR and occupancy together produce gross revenue. What owners actually keep is determined by something less glamorous.
The Cost Structure That Determines Whether Strong Revenue Becomes Strong Returns
All operating expenses combined should total no more than 45 to 55% of gross revenue. That's the threshold most STR analysts and experienced property managers cite as the line between an investment that makes sense and one that quietly bleeds money regardless of how impressive the top line looks.
Management fees are the largest variable cost and carry the widest range. Full-service STR management typically runs 18 to 40% of gross rental revenue, per industry surveys by Lodgify and Hostfully. Most operators fall in the 18 to 25% range. Luxury markets and resort destinations often see fees reaching 30 to 40%, and that premium reflects genuine operational complexity. A home with a pool, a hot tub, a game room, and a gourmet kitchen takes substantially more labor to turn, inspect, and maintain than a one-bedroom condo. You're not paying more for identical service; you're paying more because the service itself is harder to execute.
Other cost categories compound quickly at the luxury level. Cleaning costs more per turn because the home is larger and the standard is higher. Maintenance covering pool heating, landscaping, HVAC systems, and smart-home infrastructure can be substantial, especially in climates that stress equipment. Platform fees add up, with Airbnb's host fee running 3 to 15% depending on structure. Insurance for a luxury STR requires specialized short-term rental coverage that sits well above a standard homeowner's policy. And STR income is subject to occupancy and lodging taxes that vary by jurisdiction; mishandling this is a common and genuinely costly mistake, particularly for owners who weren't paying close attention during due diligence.
Where luxury STRs run structurally leaner than hotels: no round-the-clock front desk, no lobby overhead, no commercial utility footprint. Smart locks, digital check-in systems, and remote management tools reduce staffing costs in ways that a hotel physically cannot replicate. That structural advantage is real.
Cost discipline is what separates a property that looks profitable from one that actually is. The nightly rate is where the conversation starts, not where it ends.
What Specific Amenities and Property Features Do to the Revenue Ceiling
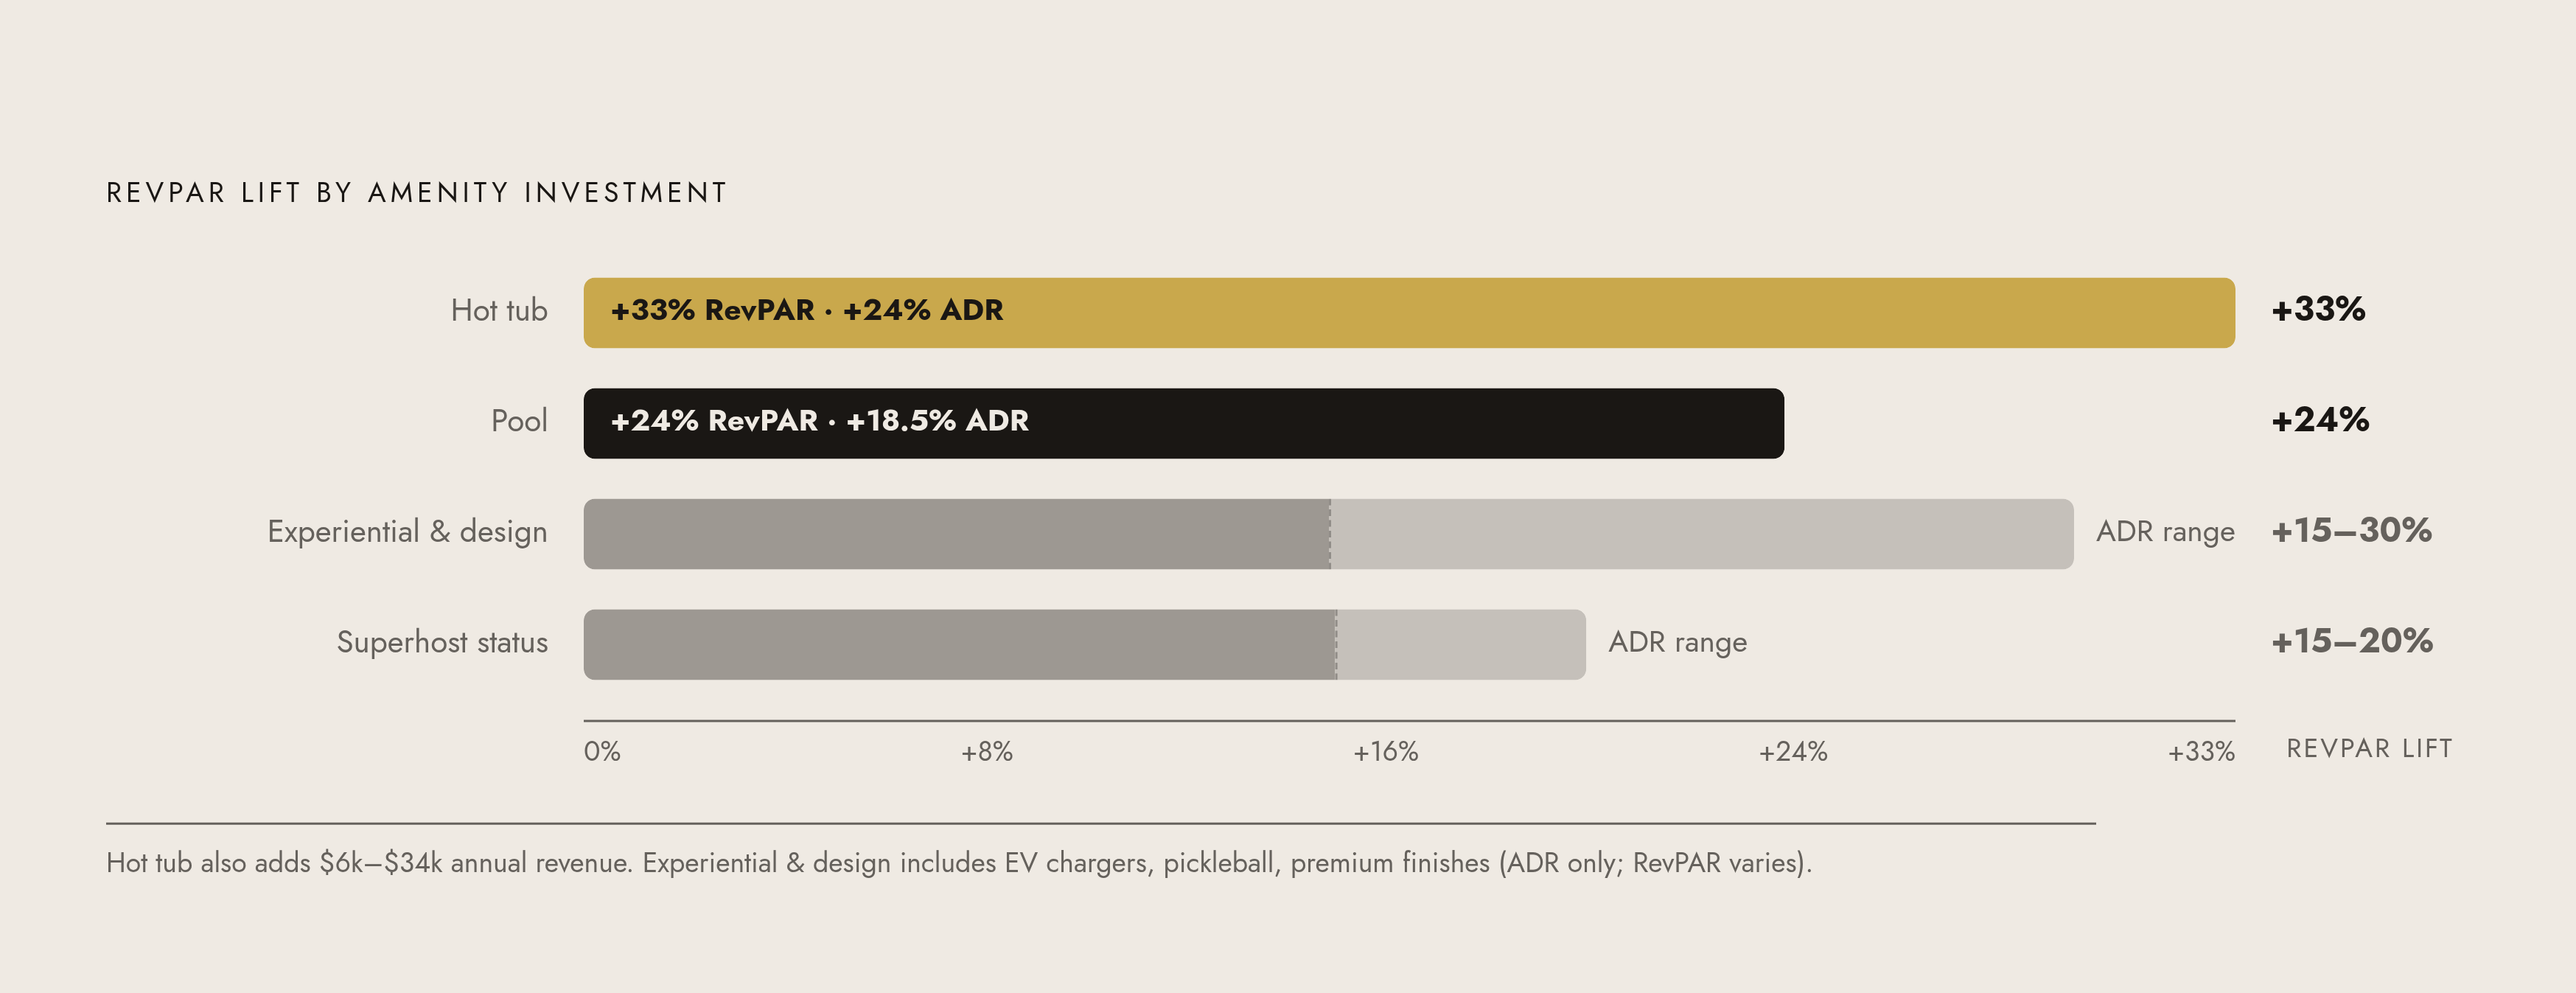
No controllable factor has a more empirically documented return than amenity upgrades, and the numbers here are specific enough to actually drive capital allocation decisions.
Hot tubs increase ADR by an average of 24%, lift occupancy by 7%, and produce a 33% uplift in RevPAR, per AirDNA amenity impact studies. In dollar terms, that translates to $6,000 to $34,000 in additional annual revenue depending on market and property size. Pools add an 18.5% ADR boost, 5% higher occupancy, and a 24% jump in RevPAR, with rate premiums in the 14 to 22% range. These are material changes to the revenue ceiling, not cosmetic ones.
Property scale matters in parallel. Each additional bedroom typically adds $50 to $100 per night, per Vacasa pricing data. A four-bedroom vacation home with outdoor amenities can command three to four times the rate of a studio in the same neighborhood. Entire homes carry a 50 to 100% ADR premium over private rooms in most markets, per AirDNA. That premium isn't irrational. It reflects what the guest is actually purchasing: exclusivity, space, and the complete absence of strangers sharing their vacation.
Less obvious but equally measurable: EV chargers, premium interior design, and experiential features like pickleball courts signal to prospective guests that this property occupies a different category. These features consistently justify 15 to 30% ADR premiums and function as organic marketing assets, generating the kind of listing photography and guest reviews that drive demand without requiring the owner to lift a finger.
Airbnb's published host data shows Superhosts with ratings of 4.9 or above command 15 to 20% higher ADR than comparable non-Superhost listings. A guest review isn't social proof in the soft sense; it's a financially quantifiable output of property quality and operational consistency.
Amenity improvements raise ADR and occupancy simultaneously, which means their RevPAR impact is larger than either effect would be in isolation. That compounding is the whole argument for investing ahead of the market.
Why Market Selection Determines the Ceiling on Returns Before Any Other Factor
STR investing is hyper-local in a way that few asset classes replicate. Identical amenities, identical management quality, identical pricing sophistication: they produce dramatically different returns depending on where the property sits. This is the variable that precedes everything else, and it's the one investors most frequently underweight.
Structurally strong luxury markets share a consistent profile. Proximity to a major metro matters because the two-hour drive rule captures a reliable demand base of affluent travelers seeking short getaways without the friction of air travel. Demand anchored to repeatable events, seasons, or geography — ski season, beach season, annual festivals — protects against the volatility of one-time spikes. And constrained supply is the characteristic that most protects pricing power over time. Markets where new inventory is difficult to add, whether due to coastal geography, mountain topography, or restrictive zoning, tend to protect existing owners in ways that suburban markets cannot.
National STR supply decreased by 23% year-over-year as of May 2025, per AirDNA, driven by regulation, elevated acquisition costs, and zoning conflicts. Markets with natural supply constraints stand to benefit disproportionately from that contraction because their inventory was already protected before the broader pullback began.
The New York City case illustrates what regulatory supply compression looks like in practice. After Local Law 18 took effect in September 2023, Airbnb listings dropped from more than 38,000 to roughly 6,800, per Inside Airbnb data. Hotel occupancy surged above 90%, nightly rates climbed into the high $300s and above $400 in many districts, and RevPAR rose 19% in 2024, per STR Global data cited in Hotel News Now. The owners who remained operational benefited substantially. The ones who didn't had their operating model extinguished.
South Florida waterfront villas and luxury condos command several hundred to several thousand dollars per night. Aspen and Nantucket sustain $1,000-plus ADR reliably. Mountain destinations broadly are seeing a meaningful comeback in 2025.
One market category deserves deliberate scrutiny: established STR destinations where early-mover advantages have already been capitalized into acquisition prices. If a market is widely discussed as a high-performing STR destination, that reputation is reflected in what sellers are asking. The analysis must begin with purchase price, not nightly rate. A $600,000 Miami condo at $500 per night is a fundamentally different investment thesis than a $1.2 million Hamptons home at $1,500 per night; comparing them without anchoring to acquisition cost and yield analysis is a category error.
How Regulation Reshapes the Return Calculus in Luxury Markets Specifically
Regulation is the baseline operating environment now, not a tail risk. A 2023 analysis by the National Association of Realtors found that approximately 80% of Airbnb's top 200 markets were regulated by local governments by the end of that year. Treating regulatory risk as peripheral is simply a misreading of the landscape.
The NYC case study remains the sharpest illustration. Local Law 18 effectively eliminated 83% of active Airbnb listings in one of the highest-demand cities in the world, per Inside Airbnb data, and it happened fast. The owners who remained operational saw improved market conditions. The owners who didn't saw their operating model extinguished.
The regulatory frontier kept expanding through 2024. Bozeman, Indianapolis, Jackson, Lexington, St. Louis: all newly introduced STR regulations during this period, per tracking by the Short Term Rental Association. These are not markets that investors typically flagged as regulatory hot zones, and that's precisely the point.
For luxury owners specifically, the regulatory risk is more consequential than it is for budget operators because there is substantially more capital at stake in a shutdown. Owner-present permit requirements, primary-residence restrictions, and minimum-stay mandates all alter the operating model in ways that can invalidate a luxury property's business case entirely. A minimum-stay restriction directly undermines the late-booking strategy that captures premium last-minute demand. That's not a minor operational inconvenience; it's a structural change to how revenue gets made.
The geographic nuance matters here. Luxury markets in constrained geographies — the Hamptons, Aspen, coastal Florida — carry different regulatory profiles than dense urban cores. The risk is not uniform across luxury markets, and treating it as such is an analytical error with real financial consequences.
The most defensible posture is to prioritize markets with stable, well-established STR ordinances over markets where legislation is actively under debate. A restrictive ordinance that has been in place for five years is materially less risky than a permissive market where city council is currently deliberating. Regulation is the one variable that no pricing tool, amenity upgrade, or management skill can overcome, which is exactly why it belongs in the market-selection analysis rather than as an afterthought.
How Pricing Strategy Turns a Strong Market and Property Into Realized Returns
Static pricing is a margin leak, and not a small one. Property managers using dynamic pricing tools see 12 to 18% higher profit margins than those relying on fixed rates, per a PriceLabs study. In a luxury market where the variance between a slow Tuesday in February and a peak holiday weekend can exceed 200%, leaving pricing static means systematically undercharging when demand is high and failing to fill inventory when it's soft. Both failures cost real money.
What dynamic pricing captures that static pricing misses is the full texture of demand: seasonal swings of 40 to 80%, holiday surges driving rates 200 to 250% above average nightly rates in the strongest markets, and the late-booking trend that now accounts for 24 to 31% of all bookings made within five days of check-in. That last category is an underutilized opportunity. Holding inventory at full price rather than discounting to guarantee a fill is often the correct call in luxury markets, where the guest cohort is less price-sensitive than almost any other segment.
Many owners, particularly new ones, feel the anxiety of an unfilled calendar and discount preemptively. In luxury, the guest who books a $3,500 weekend villa three days before arrival is not the guest you want to have preemptively displaced by someone who paid $2,800 two months out. The math is straightforward once you've watched it play out a few times.
Dynamic pricing tools don't replace judgment; they inform it. The best operators use pricing software to set the algorithmic floor and ceiling, then apply market knowledge and property-specific context to the adjustments that actually matter: holiday weekends, local events, competitive supply shifts. The tool handles routine optimization. The operator handles strategy. Conflating the two is how owners end up over-relying on software defaults and leaving money on the table in predictable, recurring ways.
The returns in luxury short-term rentals are real, but they are produced by deliberate decisions at every layer: market selection, property positioning, cost management, and pricing discipline applied consistently. Weakness in any one of those layers surfaces in the yield, usually when the owner least expects it.